

If you use items coming from this site, please quote:
Le Novère and Changeux (1995-97).http//:www.pasteur.fr/units/neubiomol/
1-Present address: Section of physiology, department of biomedical sciences, university of Modena, Modena, Italy.
keywords: acetylcholine, dopamine, habenula, ion channel, locus coeruleus, substantia nigra.
Although the neuronal nicotinic receptor a6 subunit was cloned several years ago, its functional significance remains to be investigated. Here we describe an in situ hybridisation study of the mRNA coding for this subunit in the adult rat central nervous system using oligonucleotide probes. Specific a6 mRNA labelling was restricted to a few nuclei throughout the brain; it was particularly high in several catecholaminergic nuclei [the locus coeruleus (A6), the ventral tegmental area (A10) and the substantia nigra (A9)] at levels significantly higher than those found for any other known nicotinic receptor subunit mRNA. Labelling for a6 mRNA was also detected at lower levels in the reticular thalamic nucleus, the supramammillary nucleus and the mesencephalic V nucleus. Some cells of the medial habenula (medioventral part) and of the interpeduncular nucleus (central and lateral parts) were also labelled. The distribution of a6 mRNA was compared with the distribution of the other known nicotinic acetylcholine receptor subunit mRNAs. In several nuclei, the expression of a6 was complementary to those of other a subunits. Moreover, some of the cell groups (such as the substantia nigra, the ventral tegmental area and the locus coeruleus) previously thought to contain mainly a3 mRNA in fact were found to contain high levels of a6 mRNA. Finally, we found extensive colocalization of a6 and b3, indicating the possible existence of nicotinic receptor hetero-oligomers containing both subunits. The present results show that a6 is the major nicotinic acetylcholine receptor a subunit expressed in dopaminergic cell groups of the mesencephalon and noradrenergic cells of the locus coeruleus. This suggests the involvment of the a6 subunit in some of the major functions of central nicotinic circuits, including modulation of locomotor behaviour and reward.
The nicotinic acetylcholine receptor (nAChR) belongs to the superfamily of ligand-gated ion channels (LGIC)(Cockroft et al. 1992, Galzi and Changeux 1994) that are largely responsible for fast responses to neurotransmitters. The nAChR is an allosteric protein composed of five subunits. These subunits are named a if they carry a cystein pair that belongs to the main component of the acetylcholine binding site, and non-a if they lack this pair (Changeux 1991). Molecular cloning methods have revealed the existence of sets of homologous genes encoding nAChR subunits in the amniote nervous system which have been named a2-9 or b2-4 (Sargent 1993, Elgoyhen et al. 1994, Le Novère and Changeux 1995). In neurones, two subfamilies of subunits have been identified. a7-a9 form a-bungarotoxin-sensitive receptors, whereas a2-a5 and b2-b4 containing nAChRs are not sensitive to this toxin (Boulter et al 1987, Sargent 1993, Gerzanich et al. 1994). Sequence comparison indicates that a6 belongs to the subfamily of nAChRs insensitive to a-bungarotoxin (Le Novère and Changeux 1995). Yet, to date, no data exist on the pharmacology of possible a6-containing nAChRs.
Heterologous expression studies in Xenopus oocytes and in various cell types, as well as patch-clamp studies in brain and ganglionic preparations suggest that multiple subunit combinations assemble to form functional nAChRs with distinct pharmacological specificities and ionic channel properties (Wada et al. 1988, Listerud et al. 1991, Luetje and Patrick 1991, Mulle et al. 1991, Whiting et al. 1991, Ramirez-Latorre et al. 1996). Accordingly, several different combinations of nAChR subunit mRNAs and/or proteins have been identified in central and peripheral nervous structures (Sargent 1993, Conroy et al. 1992, Vernallis et al. 1993). These nAChRs are likely to be involved in diverse physiological regulatory processes. For instance, nicotine is known to increase the release of dopamine in the striatum (Westfall 1974), of noradrenaline in the hippocampus and hypothalamus (Arqueros et al. 1978, Hall and Turner 1972) and of g-amino-butyric acid in the interpeduncular nucleus (Léna et al. 1993). Moreover, the inactivation of the gene coding for the nAChR b2 subunit provides mutant mice with several characteristic alterations at the molecular, cellular and behavioural levels (Picciotto et al. 1995).
Numerous in situ hybridisation studies have been performed in order to detect the neuronal nAChR subunits present in the nervous system of the adult (Goldman et al. 1986, Deneris et al. 1989, Wada et al. 1989, 1990, Dineley-Miller and Patrick 1992, Séguéla et al 1993, Rust et al. 1994, Cimino et al. 1995) and embryonic (Zoli et al. 1995) rat. Yet, the distribution of a6 mRNA has not been described in details. Here we present a detailed study of the distribution of a6 mRNA in the adult rat central nervous system (CNS). The pattern of labelling, as the codistribution of a6 with the other subunits of the nAChR, leads us to suggest that a6-containing nAChRs contributes to several of the known pharmacological effects of nicotine.
The in situ hybridisation method used is described and discussed in great detail in Wisden and Morris (1994).
Following analysis for mRNA secondary structure using GCG Sequence Analysis Software 7.1 (Genetic Computer Group, Madison, Wisconsin), probe sequences were chosen in unique regions of the mRNAs, without putative secondary structure, containing 50-60% GC. oligodeoxynucleotide were synthesized in a Cyclone DNA synthesiser (Biosearch inc.) or obtained from Genset (Paris, France). The probes are described in the Table 1. Each of the nAChR subunit sequences can be retrieved at the World Wide Web address http://www.pasteur.fr/units/neubiomol/LGIC.html or from Genbank (accession numbers are specified in Table 1).
The oligodeoxynucleotide probes were labelled at the 3' end using [a33P]dATP (NEN, Boston, MA) and terminal deoxynucleotidyl transferase (Boehringer Mannheim, FRG) following the specifications of the manufacturer to a specific activity of 200-600 KBq/pmol. The labelled probes were precipitated in ethanol, separated from unincorporated [33P]-dATP by means of NucTrap push columns (Stratagene, La Jolla, CA), precipitated again in ethanol and resuspended in distilled water.
Six adult Sprague-Dawley rats (Iffacredo, Lyon, France), weighting 300-400 g, were used. The animals were killed by chloral hydrate injection (1 ml of 35% solution); the brain was rapidly dissected out and frozen in dry ice powder. The tissues were stored at -80°C until cut.
Frozen tissues were cut at the cryostat (14 mm thick sections), thaw mounted on poly-L-lysine coated slides and stored at -80°C (for <2 weeks). The procedure was carried out according to Young et al. (1986), modified as described in Zoli et al. (1995) and in the following protocol. Briefly, sections were fixed with 4% paraformaldehyde for 5 min at room temperature, washed in PBS, acetylated, and stored in 80% ethanol at 4°C. Sections were then delipidated in ethanol and chloroform (5 min), prehybridized for 2-4 h at 37°C and hybridized for 20 h at 37°C under parafilm coverslips. The composition of the prehybridisation and hybridisation mixtures was: 50% formamide, 0.6 M NaCl, 10 mM dithiothreitol, 10% dextran sulfate, 1 mM EDTA, 1× Denhardt's solution (50× = 1% bovine serum albumin/1% Ficoll/1% polyvinylpyrrolidone), 0.1 mg/ml polyA (Boehringer), 0.5 mg/ml yeast tRNA (Sigma), 0.05 mg/ml herring sperm DNA (Promega, Madison, WI) in 0.02 M Tris-HCl, pH 7.5. Probes were added in the hybridisation mixture at a concentration of 0.55 nM (corresponding to ~15 fmol/section or 3000-25000 Bq/30 µl/section according to the labellings).
After removal of coverslips and initial rinse in 2× standard saline citrate (SSC) solution (0.3 M NaCl, 0.03 M sodium citrate) at room temperature (twice for 5 min), sections were washed three times for 15 min in 1× SSC at RT, then for 15 min in 0.5× SSC at ~55°C. The probes used in this study had the same length and approximately the same GC content. The melting temperature of the different oligodeoxynucleotide/mRNA duplexes, calculated using equation 3 of Wahl et al. (1987), were similar, the same hybridisation conditions being used (0.6 M NaCl, 50% formamide). The temperature of the more stringent wash was chosen to be Tm -20° (in 0.01 M NaCl, 0% formamide, Table 1), in order to correct for the small differences in GC content between the different probes. We have previously shown that this wash temperature gives an optimal signal-to-noise ratio, with nearly maximal specific signal with low non-specific signal.
The sections were then rinsed for 15 min in 0.5× SSC at room temperature. After rinsing in ice-cold water and drying through an alcohol gradient, they were exposed to [3H]Hyperfilm (Amersham) and then to a photographic emulsion (NTB2, Kodak, Rochester, NY).
| target | probe code | accession number | probe position | Sequence of the oligodeoxynucleotide | %GC | Tm(°C) |
|---|---|---|---|---|---|---|
| a2 | 59 | L10077 | 1425 | 5'-CTCCAGCATCCATGTTAGTCTCTAGCCAATGGTATGAGGGGCTGA-3' | 51%GC | 75.6 |
| a3 | 31 | L31621 | 1040 | 5'-CCCAAGTGGGCATGGTGTGTGTGGTTGGAGTTCTATAGTGCAC-3' | 53%GC | 76.2 |
| a3 | 46 | L31621 | 1138 | 5'-GCGCCGTAGAAGGTCCTCGTCTTAGGAGTGTCCCCCTCACCACTG-3' | 62%GC | 83.5 |
| a3 | 109 | L31621 | 215 | 5'-GGACACCTCAAACTGGATGATGACTGGATGGGACACATTAGCCAC-3' | 51%GC | 75.6 |
| a3 | 110 | L31621 | 623 | 5'-CTCCCAGTAGTCCTTGCGGTTCATGGAGGAGCCGATGAGGACCAG-3' | 58%GC | 80.6 |
| a4 | 47 | M15681 | 1389 | 5'-GCTGCTTCTTGGGAGCTGGGCACATGCTGGACACTCAGGGACCTG-3' | 62%GC | 83.5 |
| a4 | 49 | M15681 | 1271 | 5'-CCTTCTCAACCTCTGATGTCTTCAAGTCAGGGACCTCAAGGGGGG-3' | 55%GC | 78.5 |
| a5 | 58 | J05231 | 1076 | 5'-CCGAGATTTAGGTCCAGCCCCACTCTCGGCTTCTTCTCTCTGAGT-3' | 56%GC | 79.2 |
| a6 | 132 | L08227 | 325 | 5'-TCAAAGTGCACCGTGACGGGATCAGAAACGTTTTCCACTGGCCGG-3' | 56%GC | 79.2 |
| a6 | 133 | L08227 | 1575 | 5'-GCCCCACAGTTCCAAACACACAGACGATTATAAACACCCAGAGGA-3' | 49%GC | 74.2 |
| b2 | 36 | L31622 | 1341 | 5'-AGCCAAGCCCTGCACTGATGCAGGGTTGACAAAGCAGGTACATGG-3' | 55%GC | 78.5 |
| b2 | 37 | L31622 | 1455 | 5'-TCGCATGTGGTCCGCAATGAAGCGTACGCCATCCACTGCTTCCCG-3' | 60%GC | 82 |
| b2 | 51 | L31622 | 1315 | 5'-TGACAAAGCAGGTACATGGGTCAGCCGCAGGACCTTCACCGAAGA-3' | 55%GC | 78.5 |
| b3 | 130 | J04636 | 1306 | 5'-CAGAACTCTTTCTCCATCGCTGGCGGGAGTCTGTTTCCTTTTGCC-3' | 53%GC | 77 |
| b3 | 131 | J04636 | 431 | 5'-ATTCTTCCGGATTCCAGCGTAATTTTTGGTCTGTGCATTCCTGCT-3' | 42%GC | 69.4 |
| b4 | 61 | J05232 | 1020 | 5'-ACCAGGCTGACTTCAAGACCGGGACGCTTCATGAAGAGGAAGGTG-3' | 55%GC | 78.5 |
| b4 | 62 | J05232 | 1259 | 5'-AGCTGACACCCTCTAATGCTTCCTGTAGATCTTCCCGGAACCTCC-3' | 53%GC | 78.5 |
| TH | 73 | 5'-AGGGTGTGCAGCTCATCCTGGACCCCCTCCAAGGAGCGCT-3' | 65%GC | 83.4 |
In order to quantitatively compare different experiments, we defined a correction factor. This factor adjusts for differences in radioactive labelling of the probes (i.e. their specific activity) and exposure time of the slides to the autoradiographic film. For instance, in a given experiment probe A may give twice the autoradiographic signal of probe B (i.e. a specific optical density two fold higher); however, if SA is equal to 4SB, the actual amount of probe B binding is twice the actual amount of probe A binding.
The total exposure factor S was calculated as follows (derived from the integration of the decay equation for [33P]):
S=36.6 × A0 × (e-0.00273t1- e-0.00273t2)
Where A0 is the specific activity of the probe just after the radioactive labelling (t0), in KBq/pmole, t1 the delay between the time of probe specific activity determination and the beginning of exposure to the film and t2 the delay between the time of probe specific activity determination and the film development, in days.
Specificity controls of the oligonucleotides were performed as reported in Zoli et al. (1995).
Two or more oligonucleotides (Table 1) were used to characterize the specificity of labelling. Afterwards, one oligonucleotide/mRNA was used in the mapping (Table 4). Each anatomical level was analysed in at least three (and up to five) independent experiments.
The analysis of the labelling pattern was carried out on both film and emulsion autoradiograms. Identification of anatomical structures was carried out after counterstaining the sections with toluidine blue. Definition of anatomical areas in the brain was based on different atlases, including those of Paxinos and Watson (1986) and Swanson (1992).
A relative quantification of the mRNA levels of the different subunits in the mesencephalic dopaminergic nuclei was carried out by means of the Vidas image analyser (Kontron, Munich FRG) on the autoradiograms. Radioactivity microscales were also exposed to the films in order to ascertain that the grey levels of the specific labelling were in the linear portion of image analyser response curve. Two different experiments were considered. Six levels were analysed in one rat brain (Bregma -4.7 to -6.3 mm) and four in another (Bregma -4.8 to -6.1 mm). After a thresholding procedure which allowed the selective retention of the specific signal, the mean grey value (MGV) and the retained area were measured. The total integrated optical density (TOT) was then calculated from the integrated optical density of each level as follows:
| TOT | = | S integrated optical density |
| = | S retained area * log (MGVbackground/MGVtotal) |
After correction (COR) for S (for the subunit i, CORi = TOTi/Si), the results were expressed as ratio of the b2 subunit values (CORi/CORb2) in each experiment. b2 was arbitrarily chosen as a reference, since it is the most diffuse and relatively homogeneous subunit mRNA in the adult rat brain.
Determination of the Kd and Bmax values for the a3 probes was performed by hybridizing adjacent brain sections with ten probe concentrations. We plotted optical density against probe concentration (the non-specific binding was determined by adding an excess of cold probe). Fitting a Langmuir isotherm provided the quantitative parameters.
Cell count of emulsion autoradiograms was performed at Bregma level -5.3 mm. Recognition of neurone was based on counterstaining of the sections with toluidine blue. Two square fields (380x250 mm) were analised in each region. The sampled fields were placed in the pars compacta of the substantia nigra, or in the centre of the Ventral Tegmental Area. Neurones were considered positive when they were overlain by at least three times the background density of grains.
in situ hybridisation with oligodeoxynucleotides was selected in order to minimise cross-recognition of different members of the nAChR subunit family and to allow quantitative comparisons between several experiments. This method is less sensitive than cRNA probe-based in situ hybridisation, as the oligodeoxynucleotide is labelled only at the 3' end, whereas cRNA probes are labelled over the entire sequence. On the other hand, oligodeoxynucleotides may penetrate more easily in fixed tissue. Apart from the sensitivity issue, oligodeoxynucleotide-based in situ hybridisation has several advantages over cRNA probe-based in situ hybridisation, especially when families of genes are investigated.
First, the oligodeoxynucleotides can be chosen within highly specific regions, which is not always true for cRNA probes. For instance, probes used in previous nAChR studies were often directed against the entire coding sequence, and then, against some highly conserved parts. In order to generate more efficient probes, authors often cut them to 50-200 nucleotide fragments, a method which probably generates non-specific signal as well as cross-recognition between close members of the same gene family.
Second, the in situ hybridisation with oligodeoxynucleotides is highly reproducible in every tissue and with every probe. Indeed, the control of the relevant parameters (i.e., probe concentration, specific activity and melting temperature) allows the determination of quantitative characteristics of the binding such as apparent Kd and Bmax. For the a3 subunit, a saturation study of the in situ binding characteristics of the oligodeoxynucleotides was performed in the medial habenula (Le Novère, Zoli and Changeux unpublished). Under our experimental conditions (in particular, a more stringent wash = Tm - 20 deg C in 0.5× SSC for 15 min), probe 46 gave a Kd of 0.075 nM with a Bmax of 0.13 fmol/cm2 protein and probe 109 gave a Kd of 0.17 nM with a Bmax of 0.19fmol/cm2. In general, we verified that the difference in labelling provided by the different probes against the same mRNA used in this study was < 50%. This figure must be kept in mind when evaluating the relative quantitative differences between labellings shown in Table 4.
The a6 mRNA signal was detected in a restricted number of brain areas (Table 2). The range of labelling intensity varied from barely detectable to very high. The telencephalon showed no specific labelling. In the other main CNS subdivisions, some nuclei displayed detectable levels of a6 mRNA.
| Structure | a6 | b3 |
|---|---|---|
|
diencephalon reticular thalamic nucleus medial habenula dorsal part ventrolateral part ventromedial part lateral habenula mesencephalon supramammillary substantia nigra pars compacta pars lateralis pars reticulata (scattered cells) ventral tegmental area interpeduncular nucleus apical part central part lateral part rostral part mesencephalic V nucleus rhombencephalon locus coeruleus | ++ - - + (+) (+) +++ +++ +++ +++ - + + - ++ +++ | + - - +++ + - ++ ++ ++ ++ - (+) (+) - +++ ++ |
In the diencephalon, three nuclei were labelled by a6 probes, but with different intensities.
The reticular thalamic nucleus exhibited a rostro-caudal and dorso-ventral gradient of a6 labelling (Fig. 1). Labelling intensity was modest even in the rostrodorsal part. b2 and a4 were also found in the reticular nucleus, although at a rather low level. The b3 subunit was barely detectable in only one out of five adult animals (data not shown).
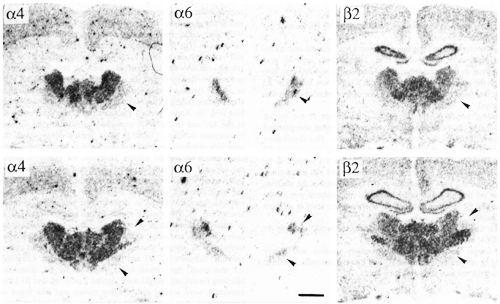
Figure 1:
Bright-field photographs of film autoradiograms showing distributions of a4 (S=4648), a6 (S=1623) and b2 (S=3000) nAChR subunit mRNAs in adjacent sections of the anterior (upper panels) and posterior (lower panels) reticular thalamic nucleus. For details of S values, see Materials and methods. Upper panel, bregma level -1.4 mm. Lower panel, bregma level -2 mm. Arrowheads indicate the reticular thalamic nucleus. Scale bar = 1mm.
high resolution
a6 labelling was restricted to a small part of the medial habenula (Fig. 2). In the medial habenula, a6 labelling was detected in some medially located cells lining the ventricle. This distribution corresponded to that of b3. However, the labelling intensity for b3 was stronger. The distribution of a6 (or b3) mRNA seems complementary to that of a4 mRNA. In contrast, a3 and b4 labelling was detected at a high level all over the ventral part of the nucleus, whereas a5 labelling was restricted to the ventrolateral part of the nucleus and b2 labelling was present at a moderate level in all parts of the nucleus.
In the lateral habenular nucleus, we detected weak labelling for a6 mRNA, as well as for b3 and b2.
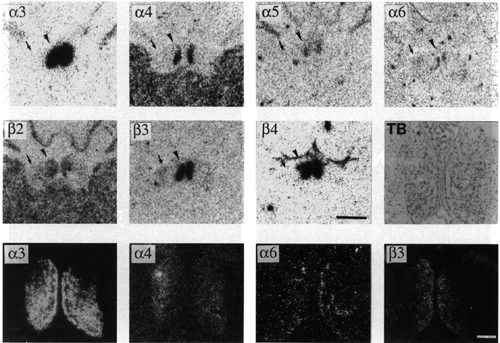
Figure 2:
(Upper panels) Bright-field photographs of film autoradiogram showing distribution of a3 (S=3469), a4 (S=4010), a5 (S=2735), a6 (S=3227), b2 (S=4092), b3 (S=2710) and b4 (S=3617) nAChR subunit mRNAs in adjacent sections of the habenular nuclei. Arrowheads and arrows indicate the medial and lateral habenula, respectively. Scale bar = 1mm. Note that at this magnification, a6 labelling of the medial habenula is barely detectable.
(Lower panels) Dark-field microphotographs of emulsion autoradiograms showing distribution of a3 (S=15462), a4 (S=7953), a6 (S=1857) and b3 (S=3512) nAChR subunit mRNAs in adjacent sections of the medial habenula. The toluidine blue (TB) counterstaining is reported in the last panel of the intermediate row. Scale bar = 200 mm. Note that the distribution of a6/b3 and a4 are complementary.
For details of S values, see Materials and methods. Bregma level -3.3 mm.
high resolution
The caudal part of the supramammillary nucleus was lightly labelled by a6 probes. Probes for a5 and b2 revealed weak labelling. Labelling for a4 was absent or very light.
The mesencephalon showed three areas containing specific a6 mRNA signal.
Mesencephalic dopaminergic cell groups showed a wide variety of nAChR subunit mRNAs (Fig. 6). Labelling for a6 was very high in the substantia nigra (A9), pars compacta (SNc), VTA (A10) and retrorubral area (A8) (Fig. 3). Scattered cells showing high a6 labelling intensity were also present in the mesencephalic periventricular zone and in the substantia nigra pars reticulata (SNr), possibly corresponding to the periventricular mesencephalic dopamine system and to the dopamine neurones of the SNr. Neurones of SNc and VTA were rather homogeneously labelled in the different parts of these nuclei. The b3 subunit was detected at a somewhat lower, but still very high, level (Fig. 4). In order to determine if a6 and b3 subunit mRNAs are localised in dopamine cells, we counted the neurones labelled by probes directed against the two nAChR subunits or against tyrosine hydroxylase, the dopamine biosynthetic enzyme, after counterstaining of the in situ hybridisation sections with toluidine blue (Fig. 5). Approximately the same percentage of neurones (80%) in the SN and in the VTA contained specific a6, b3 or tyrosine hydroxylase labelling (Table 3). This finding demonstrates that at least 50% of tyrosine hydroxylase positive (i.e. dopamninergic) neurones also contains a6 and b3 mRNA. However, the extensive overlap at the regional level between cells containing a6, b3 and tyrosine hydroxylase mRNA suggests that these three mRNAs are present in the same neuronal population. Signals for a4, a5 and b2 subunit mRNA were also found in dopaminergic nuclei but at moderate levels (Fig. 6). The specific signal for a3 mRNA was very weak. A relative quantification of the transcripts was performed on the autoradiograms according to the method described in Material and Methods. The results, shown in Table 4, defined four classes of subunits. a2, a7 and b4 were not detected. Labelling for a3 was weak, three times lower than b2. Intensities of labelling for a4, a5 and b2 were similar. Lastly, a6 and b3 labelling intensities were several times higher (seven and four times more respectively) than b2. Moreover, a6 labelling intensity was probably underestimated, since the autoradiographic films were partially saturated. No relevant differences were found between the A9 and A8/A10 nuclei for the ratio of labelling between the different subunits.
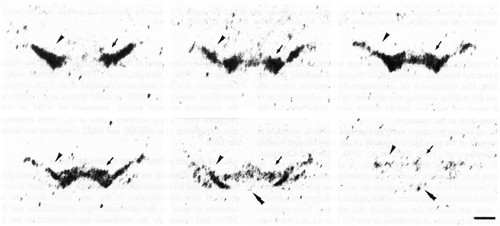
Figure 3:
Bright-field photographs of film autoradiograms showing a6 (S=1623) nAChR subunit mRNA distribution at 6 coronal levels (bregma levels -4.8, -5.2, -5.3, -5.7, -6.1 and -6.4 mm) of the ventral mesencephalon. For details of S values, see Materials and methods. Arrowhead, arrows, and double arrowheads indicate the ventral tegmental area, substantia nigra pars compacta and interpeduncular nucleus respectively. Scale bar = 1mm.
high resolution
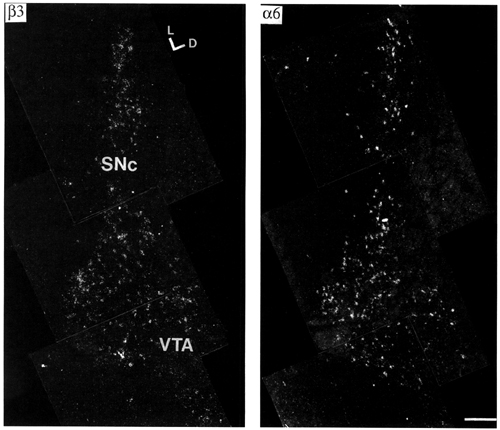
Figure 4:
Dark-field microphotographs of emulsion autoradiograms showing distribution of a6 (S=1857) and b3 (S=3512) nAChR subunit mRNAs in adjacent sections of the substantia nigra, pars compacta (SNc) and ventral tegmental area (VTA). For details of S values, see Materials and methods. Note the very similar distribution of the two mRNAs in these regions. Bregma level -5.3 mm. Scale bar = 200 mm. Abbreviations: D = dorsal, L = lateral.
high resolution
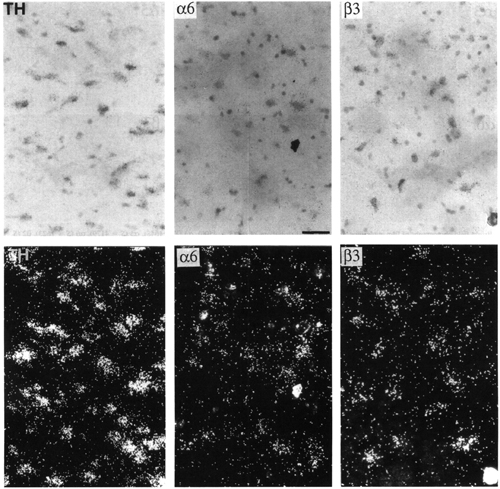
Figure 5:
Bright-field (upper panels) and dark-field (lower panels) microphotographs of emulsion autoradiograms showing distributions of tyrosine hydroxylase (TH, S=4028), and a6 (S=1857) and b3 (S=3512) nAChR subunit mRNAs in adjacent sections of the ventral tegmental area. For details of S values, see Materials and methods. Tyrosine hydroxylase oligonucleotide probe was labelled with [35S]dATP (Amersham), which explains the different size of autoradiographic grains with respect to a6 and b3 . Scale bar = 40 mm.
high resolution
| SN | VTA | |
|---|---|---|
| Tyrosine hydroxylase | 76.6 ± 2.3 | 86.4 ± 1.2 |
| a6 | 83.8 ± 2.3 | 80.9 ± 1.8 |
| b3 | 83.4 ± 2.3 | 83.0 ± 3.4 |
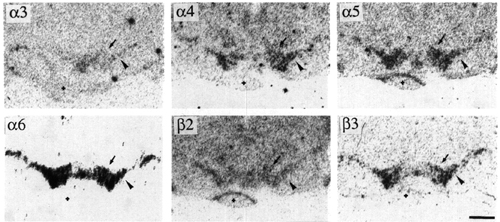
Figure 6:
Bright-field photographs of film autoradiograms showing distributions of a3 (S=4500), a4 (S=4648), a5 (S=4179), a6 (S=1623), b2 (S=3000) and b3 (S=1828) nAChR subunit mRNAs in adjacent sections of the ventral mesencephalon. For details of S values, see Materials and methods. Arrowheads and arrows indicate the substantia nigra, pars compacta, and the ventral tegmental area, respectively. The small crosses indicate a piece of cerebellum which accidentally moved into the ventral part of the brain during the freezing process. Bregma level -5.6 mm. Scale bar = 1 mm.
high resolution
| SN | VTA | |
|---|---|---|
| a3 | 0.39 ± 0.07 | 0.33 ± 0.14 |
| a4 | 0.99 ± 0.02 | 1.15 ± 0.3 |
| a5 | 1.81 ± 0.83 | 1.54 ± 0.79 |
| a6 | 7.23 ± 1.92 | 7.57 ± 1.19 |
| b2 | 1 | 1 |
| b3 | 4.35 ± 2.42 | 3.3 ± 1.76 |
Some parts of the interpeduncular nucleus were labelled by a6 probes (Fig. 3). Positive cells were located in the most caudal part of the central and lateral subnuclei. This distribution did not match those of a2, a3, a4, a5 or b4 but overlaps that of b2. b3 subunit had the same distribution as a6, but with a very low labelling intensity (detected in only one out of five adult animals; data not shown).
The neurones of the trigeminal mesencephalic nucleus were found to be labelled by a6 probes (Fig. 7). This labelling was less intense than that of b3 but stronger than that of a4 and b2. The cells labelled by a6 probes belonged only to a caudal subpopulation, just rostral to the locus coeruleus, whereas every cell of the nucleus, even around the mesencephalic central grey matter, was found to be positive for b3 probes.
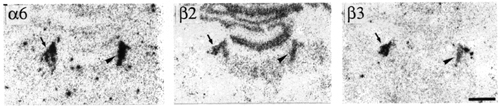
Figure 7:
Bright-field photographs of film autoradiograms showing distributions of a6 (S=3227), b2 (S=4092) and b3 (S=2710) nAChR subunit mRNAs in adjacent sections of the dorsal pons. For details of S values, see Materials and methods. Arrowheads and arrows indicate the locus coeruleus and mesencephalic trigeminal nucleus. Bregma level -10 mm. Scale bar = 1 mm.
high resolution
In the rhombencephalon, the locus coeruleus was the only nucleus labelled by a6 probes (Fig. 7). The intensity of labelling for a6 was extremely high and at the same level as that of dopaminergic cells of the mesencephalon. Several other nAChR subunit labellings were found in this nucleus, b2 and b3 at moderate level, a3 at a weak level, and a5 and a4 at very low levels.
Since the first report on the a6 subunit (Lamar et al. 1990) our knowledge of the functional significance of this subunit has not progressed significantly. Here we show that a6 mRNA is restricted to a few specific nuclei throughout the brain. The amount of a6 mRNA is particularly high in some catecholaminergic nuclei (the A6, A8, A9 and A10 nuclei) and significant, though lower, in the reticular thalamic nucleus, the medial and lateral habenula and the supramammillary nucleus. This distribution corresponds to that mentioned in the table of one previous paper (Dineley-Miller and Patrick 1992). In addition, other nuclei were found to be positive for a6 labelling, such as the interpeduncular nucleus and the mesencephalic V nucleus. Contrary to what reported in the abstract from Goldner et al. (1993), no labelling for a6 mRNA was detected in the anterior pretectal area. This discrepancy is difficult to interpret as this localisation was presented in an abstract without iconography and methodological details.
In this paper we used in situ hybridisation with oligodeoxynucleotides, a method widely used in the LGIC field (Zhang et al. 1991, Monyer et al. 1992, Poulter et al. 1992, Watanabe et al. 1992, Wisden et al. 1992, Zoli et al. 1995), although different from the in situ hybridisation method with cRNA probes that has been used until now to map the nAChR subunit mRNAs in the adult mammalian CNS (Wada et al. 1989, 1990, Deneris et al. 1989, Dineley-Miller and Patrick 1992, Rust et al. 1993, Rubboli et al. 1994, Séguéla et al. 1993). In general, our studies with oligonucleotide probes are in good agreement with previous studies with cRNA probes (with a few notable exceptions, such as a5 in the medial habenula). However, a clear discrepancy with previous results was observed for a6 mRNA labelling in a few specific nuclei. In particular, we saw a strong a6 signal and almost no a3 signal in some regions previously thought to be rich in a3 mRNA [i.e., the ventral mesencephalon and the locus coeruleus, (Wada et al. 1989)]. This discrepancy cannot be explained on the basis of a different sensitivity of the two techniques as in most brain areas our mapping agrees well with a previous mapping of a3 (Wada et al. 1989). Interestingly, a3 and a6 are phylogenetically the "youngest" nAChR subunits, and appeared around the time of the split between bony fishes and tetrapods (Le Novère and Changeux 1995). Since, according to the present study, a6 is almost 20-fold more concentrated than a3 in some regions, it is possible that a cRNA probe directed against the entire a3 sequence may also label a6 mRNA.
Our findings demonstrate that a6 and b3 mRNA labellings display a closely similar distribution in the brain. Some preliminary evidence (N Le Novère, M Zoli, JP Changeux, unpublished results) indicates that this is also the case in the peripheral nervous system. For instance, in the postnatal retina and somatosensory ganglia (such as the trigeminal ganglion), both a6 and b3 labellings were detected. In the brain, colocalisation of a6 and b3 was achieved in most labelled regions (Table2) . Labelling for b3 was sometimes detected at a lower level (thalamic reticular nucleus, interpeduncular nucleus, locus coeruleus, dopaminergic nuclei) and sometimes at a higher level (medial habenula, mesencephalic trigeminal nucleus) than a6 labelling. One exception is the supramammillary nucleus where a6, but not b3, mRNA labelling was detected. In this nucleus, the level of a6 signal was very low, and b3 mRNA levels might be below the detection limit of the technique.
The a6 subunit possesses every residue that has been identified to date as part of the principal component of the acetylcholine binding site (Dennis et al. 1988, Galzi et al. 1990, Galzi and Changeux 1994). Subunit a6 is thus an "authentic a" subunit, that may be engaged in ACh binding. The extensive colocalisation of a6 and b3 reported here, further supports the view that nAChR isoforms may assemble into hetero-oligomers, which include both types of subunits. This does not exclude the possibility that a6 may form receptors with other b subunits. A possibility is that b3, like a5, is a third type of subunit (in addition to the standard a and b types)(proposed by Le Novère and Changeux 1995). These subunits look analogous to muscle b1 subunit, a subunit which lacks both the principal and the secondary component of the acetylcholine binding site (Galzi and Changeux 1994, Corringer et al. 1995). Consistent with these conclusions, nAChRs have been identified in the CNS, composed of a4a5b2 (Conroy et al. 1992) or a4b2 (Flores et al. 1992), and in the peripheral nervous system, composed of a3b4 or a3a5b4 (Vernallis et al. 1993, Schwartz Levey et al. 1995). Similarly, we may hypothesise that a6b3b2 and a6b2 complexes are formed in the CNS.
In the lateral habenula, the distribution of a6 mRNA closely parallels that of b2 and b3 subunit mRNAs, although to date there is no direct proof of their colocalisation in the same cells. Since the lateral habenula projects to the substantia nigra (Herkenham and Nauta 1979), and conversely the substantia nigra projects to the lateral habenula (Skagerberg et al. 1984), nAChRs composed of a6b3(b2) may plausibly form in both branches of this bi-directional pathway.
As far as nAChR subunit mRNAs are concerned, the medial habenula can be subdivided into 3 subnuclei: dorsal, ventromedial and ventrolateral (Fig. 8). a6 and b3 are localised in the ventromedial subnucleus, with a gradient from the midline to the lateral part (see also Deneris et al. 1989). The more restricted distribution of a6 relative to b3 may be due to the lower level of the a6 mRNA signal. The distribution of a4 mRNA signal is complementary to that of a6 and b3. The a4 subunit was detected at a very low level in the ventromedial subnucleus, at an intermediate level in the dorsal subnucleus and at high level in the ventrolateral subnucleus (see also Wada et al. 1989 and Hill et al. 1993). Contrary to Wada et al (1990), we found a5 mRNA labelling in the medial habenula. Its distribution was restricted to the ventrolateral subnucleus. Strong a3 and b4 labelling was detected in the ventromedial and ventrolateral subnuclei as already described in Wada et al. (1989), Dineley-Miller and Patrick (1992) and Hill et al. (1993). Labelling for b2 is present almost uniformly in the whole nucleus. The ventromedial and ventrolateral subnuclei correspond to the ventral two-thirds of the medial habenula, which are formed by cholinergic neurones (Levey et al. 1987, Woolf 1995). Accordingly, a3 and b4 subunit distribution overlaps that of choline acetyltransferase expressing neurones (see Figs. 2 and 8b of Oh et al. 1992). The ventrolateral seems richer in cholineacetyltransferase than the ventromedial subnucleus (Ichikawa and Hirata 1986). Lastly, the dorsal subnucleus contains high levels of substance P (Contestabile et al. 1987).
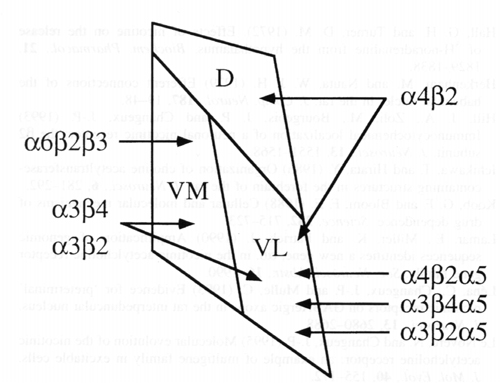
Figure 8: Schematic drawing of the distribution of nAChR subunit mRNAs in the medial habenula. The subunit combinations for which electrophysiological (in oocytes after heterologous expression of the subunits) and/or biochemical (coprecipitation) evidence has been obtained are indicated for each subnucleus. The location of of the putative a6b2b3-containing receptor is also shown. D, dorsal; VL, ventrolateral; VM, ventromedial.
The medial habenula was formerly assumed to be a homogeneous nucleus, containing several different nAChR isoforms in the same cells. The different nicotinic currents recorded from habenular neurones were thus assigned to multiple receptor isoforms present in a homogenous class of cells (Mulle et al. 1990, Mulle et al. 1991, Connoly et al. 1995). The present data, in particular that showing the segregation of a4/a5 and a6/b3 mRNAs, suggest that nAChR isoforms in the medial habenula are, at least in part, cell-specific. Based on the present and previous studies in transfected cultured cells, and in situ studies, we may infer that different nAChR isoforms are produces in the different subnuclei: a4b2, in the dorsal subnucleus; a3b4 and/or a3b2 and a6b2b3 in the ventromedial subnucleus; a3b4 and/or a3b4a5 and a4b2 and/or a4b2a5 and a3b2a5 in the ventrolateral subnucleus (Fig. 8).
The locus coeruleus and the A8, A9 and 10 nuclei displayed the highest levels of a6 subunit mRNA in the CNS. These nuclei contain high levels of tyrosine hydroxylase and are responsible for the major part of the noradrenergic and dopaminergic inervation of the brain. The stimulatory actions of nicotine on dopamine release (Westfall 1974, Giorguieff et al. 1977, Arqueros et al. 1978) are mediated by the receptors located on terminals (short-term stimulation), and by the receptors located on the dopaminergic soma of the mesencephalon (long-term stimulation). The two sets of receptors could be identical or different.
Clarke and Pert (1985) clearly showed the existence of receptors with high affinity for nicotine in the mesencephalic dopamine soma, as well as in the striatal dopaminergic terminals. Picciotto et al. (1995) demonstrated that inactivation of the b2 subunit gene results in the complete disappearance of receptors with high affinity for nicotine. At least some nAChRs on the dopamine soma and terminals are then likely to contain b2. Moreover b4 mRNA was not detected in dopaminergic cells (Duvoisin et al. 1989, Dineley-Miller and Patrick 1992; and results presented here).
The pharmacology of nicotine-enhanced dopamine release indicates that the receptor involved is not a4b2 (Rapier et al. 1990, Grady et al 1992, Sacaan et al. 1995). In striatal synaptosomes, Grady et al. (1992) found that potency was in the order cytisine = nicotine > DMPP=ACh. In striatal slices, Sacaan et al. (1995) found the order cytisine > nicotine = DMPP. These pharmacological spectra do not match the properties of an a4b2-containing receptor (Luetje and Patrick 1991). Moreover, 100 nM neuronal bungarotoxin blocks the nicotine-induced endogenous dopamine release (Schultz and Zigmond 1989). At this concentration, the toxin is able to inhibit a3b2 but not a4b2 (Luetje et al. 1990).
Here we show that a6 labelling is > 20-fold more intense than a3 labelling in the dopaminergic cells as well as in the locus coeruleus. We can therefore hypothesise that the pharmacology observed for nAChR-mediated potentiation of dopamine (and noradrenaline) release results from an a6-containing receptor. But nothing is known about the pharmacology of a6-containing nAChRs. However, the sequence similarity between a3 and a6 is very high (61% identity over the entire amino-acid sequence, the differences being located mainly in the signal peptide and the cytoplasmic loop). It is noteworthy that every identified amino acid composing the acetylcholine binding site is conserved ; in particular the whole A and C loops (Galzi and Changeux 1994) are 100% identical in the two subunits. The participation of the a3 and a6 subunits to the binding site might then be similar and may account for the pharmacological data reported initially.
Although protein levels may not parallel mRNA levels, the strong expression of b3 subunit mRNA in the tyrosine hdroxylase-positive neurones supports the notion that this subunit contributes to the nicotinic response of the catecholaminergic nuclei. At this stage no direct evidence exists for protein oligomers containing a6 and b3 in these cells. Yet, the extensive colocalisation of a6, b2 and b3 mRNA supports the view that the formation of an oligomer containing these three subunits may account for the nicotine-induced catecholamine release.
The presence of high levels of a6 mRNA in the dopamine-containing neurones might be of considerable physiological importance, since the release of dopamine mediated by nicotine is thought to mediate its locomotor and addictive properties (Clarke et al. 1988, Stolerman and Shoaib 1991). More generally, the catecholaminergic neurones of the locus coeruleus and the A8, A9 and A10 nuclei have been postulated to directly control the physical dependence on addictive drugs (Di Chiara and Imperato 1988, Koob and Bloom 1988, Nestler 1992, Schulteis and Koob 1994). The design of drugs specifically directed against the receptor subtypes responsible for these behaviours is an important challenge for modern neuropharmacology. In order to achieve this aim, the exact molecular constitution of these receptors has to be established. Here we propose that a6b2b3 nAChRs are likely candidates for the mediation of nicotine-induced potentiation of catecholamine release.
This work was supported by the Centre National de la Recherche Scientifique, the Collège de France, the Institut National de la Santé et de la Recherche Médicale (contract no. 872004), the Direction des Recherches et Etudes Techniques (contract no. 90/142) and the Commission of the European Communities (contract Biomed 94-1060).
We are grateful to Clément Léna and Dr. Lisa Marubio for critical reading of the manuscript.
| CNS: | Central nervous system |
| GABA: | g-aminobutyric acid |
| LGIC: | Ligand-gated ion channel |
| nAChR: | Nicotinic acetylcholine receptor |
| SN: | Substantia nigra |
| SNc: | Substantia nigra, pars compacta |
| SNr: | Substantia nigra, pars reticulata |
| SSC : | saline sodium citrate buffer |
| VTA: | Ventral tegmental area |